Here's an overview of what we cover in this article:
- Overview
- General Information
- Average Guests per Booking
- New VS Returning Customer
- Average Bookings per activity
- The average time between the booking and the date of the activity booked
- Booking Source
- Age/Gender Data
_______________________________________________________
Overview
With this dashboard we aim for you, provider, to get to know your customers better. We provide you with information about who they are and how they behave with your business. You can use this information to optimize your communication efforts: know whom to direct them to, know if you need to craft various messages for different target groups and when to post those messages. Below is how to get to this report:

Let's review the content of this dashboard section by section:
-
General Information

As in the first BI Dashboard, we show you first some general data about your business, in this case, all the numbers are directly affected by your customer base.
- Revenue: We show you exactly the NET revenue you get in the period you select on the calendar.
- Average bookings per activity: We go deeper into this topic in the following section, but here we offer you the main average across all your bookings and activities and in the selected period of time.
- Nº of Participants: How many guests you hosted on the given period of time.
- Nº of cancellations: How many guests canceled their trip with you in that period of time.
- Inquiries received: How many times someone had wanted to get information from your business in the given period of time.
-
Average Guests per Booking
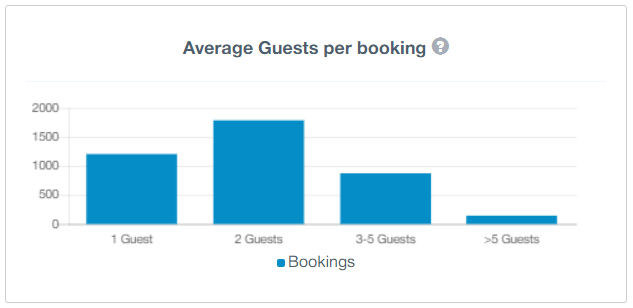
This section analyses how many guests are usually included in a single booking.
This information is useful for you to know whether you would need to launch more private tours for groups if your ">5 Guests" column is very high. Or, on the contrary, if you are more profitable hosting bigger groups of single bookings.
In the end, this data can help you a lot when it comes to organizing future trips.
-
New VS Returning Customer
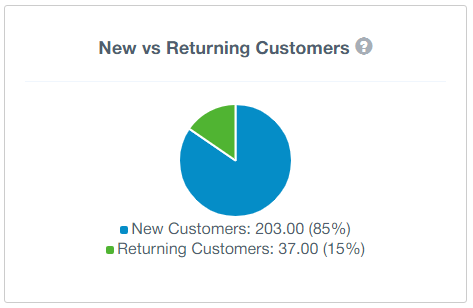
A lot of you are probably already measuring this number. It's about your customer base: do you get to see them again? or they do a trip with you once and that's it?
Maybe your current communication strategy in that area it's super good, or super bad. Or maybe your treatment towards them is not the best, but you didn't have a clue before.
This will give you ideas on how to get your clients to come back.
But, as always, a happy customer usually means more money for your business.
In order to get the correct information from this section, you need to have the Custom Field "Email" set up. This way, the system can tell who is who, and look for prior bookings, in case there are any.

-
Average Bookings per activity
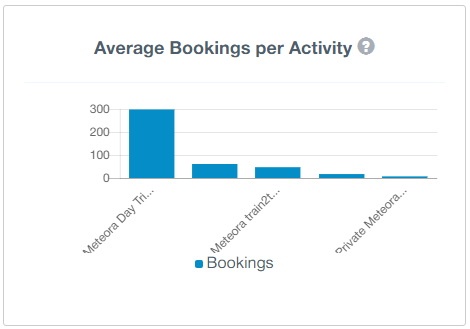
In the previous BI Section, we show you which activities give you the most revenue.
This time we wanted to see which of your activities gets a higher number of bookings. It's an easy way to know if you need to launch more trips for a single activity, or maybe related trips!
-
The average time between the booking and the date of the activity booked
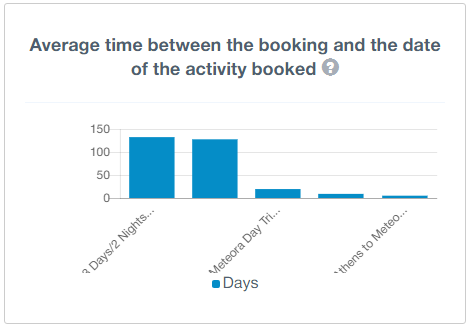
Basically, how many days in advance are your customers booking your trips? Is it a quick decision? Do they plan it for months before going to see you?
This can be very useful in order to communicate with them: how many emails can you send them before the trip, do they need to remember to take something important to them, how relevant is your trip for them?
-
Booking Source
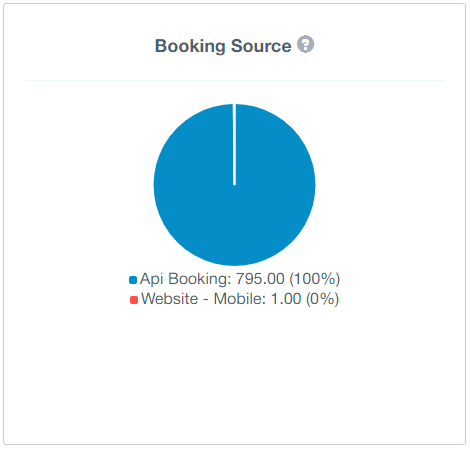
This data shows you where your customer is finding you i.e. from which channel the bookings came from.
In this example, we can see that most of the bookings came from API Booking which includes POS Desk, mPOS app, Booking Widget and Channel Manager (OTA).
Looking at this data, we can see a lot of potential on the website. Maybe by increasing the visibility of the page (either in social media, paid advertising or SEO), we could get a lot more bookings coming.
-
Age/Gender Data
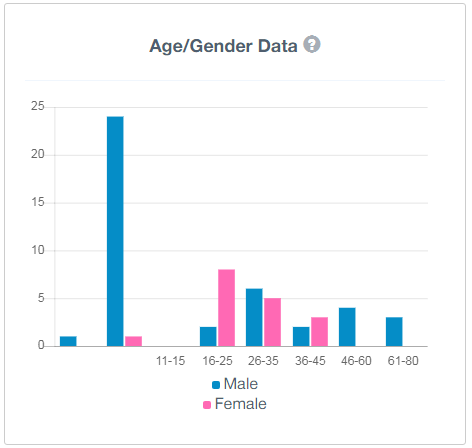 This is demographic information. You'll know for sure which group of individuals find you more appealing when organizing their spare time, and this data is basic for all your public messages.
In order to get this information right, you need to set up two custom fields: Gender and Age

For both of those Custom Fields, there is a preset field in TrekkSoft, that you can see on the "Field type" drop-down when creating new custom fields.
