Here is an overview of what we cover in this article:
_______________________________________________________
Introduction
To give you a competitive advantage, we've built the Business Intelligence Dashboard.
You can access it from the menu on the left (Business Intelligence > Overview).
To filter the information, select the period you want to analyze in the calendar on the top right corner:

You can choose a pre-set period or choose a custom range with the time frame of your interest. It can also be interesting to compare two different periods, for example, this summer's performance compared to the year before, to see how seasonality might affect your business.

_______________________________________________________
Below the calendar, you will find 4 main sections:
-
Overview:
We've highlighted five figures we believe are the most important for any company's accounting.

- Gross Sales: The total sales of your company, calculated by adding all sales invoices for the given time period. It doesn’t include discounts or returns from customers.
- Net Sales: This is the net value you've received from bookings, after deducting discounts and cancellations from your Gross Sales. It gives you a more accurate picture of the actual sales generated by your company or the money you can expect to receive.
- Number of Bookings: This reflects the total amount of bookings you've received, not including cancellations.
- Number of Cancellations: This reflects the number of people who canceled their booking with your company.
- Number of Participations: This reflects the number of people who actually showed up on the day of the activity.
-
Net Sales desk:
Here, you can find a graph that breaks down your net sales numbers within your selected time frame. You'll be able to see how your business is doing and help you make better strategic decisions.
-
Sales based on Activity:
This graph gives you a breakdown of your best-performing activities. By studying these numbers and applying them to your activities strategy (for example setting up more hours for a given activity), you can increase reservations and sales.
-
Sales based on Market:
This reflects a breakdown of the regions and countries where your customers are from. If you are able to anticipate where the people who book your tours are coming from, you can create more targeted marketing strategies for these customers. If you find them before they find you, you’ll already be ahead of your competitors, gaining a bigger share of the very same market.
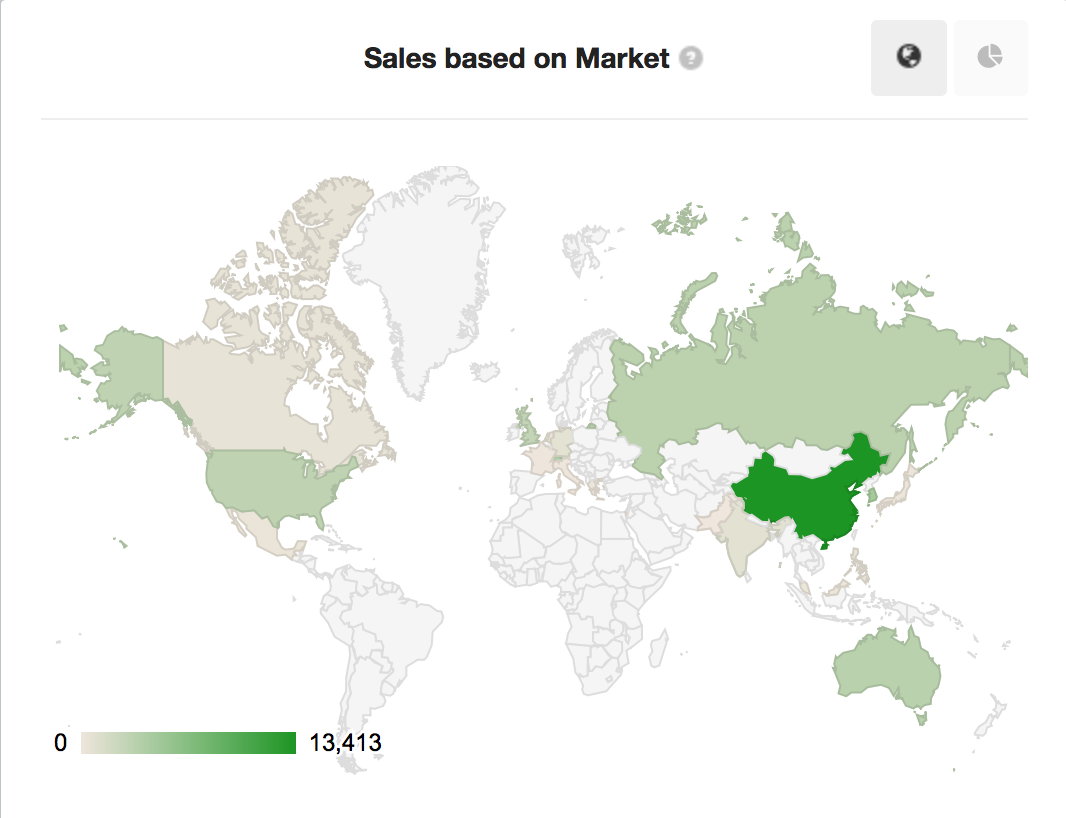
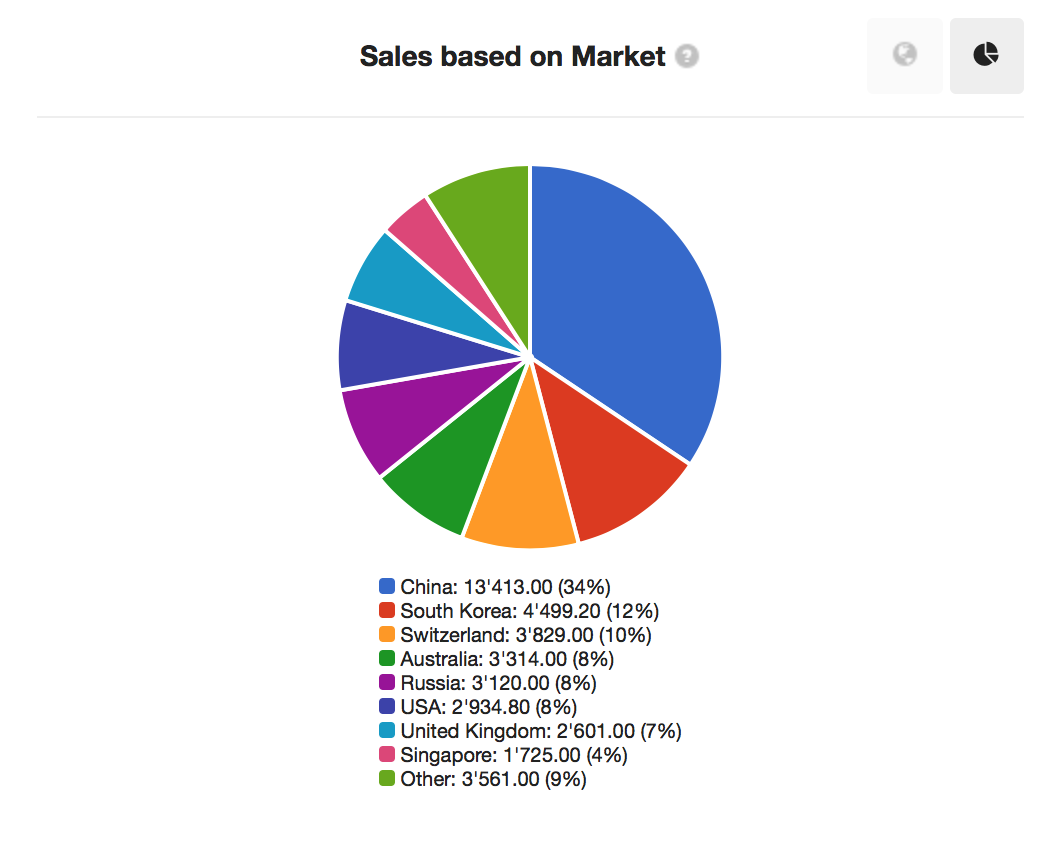
You can choose between two different views here: either a colored map where the darkest is the country you receive the most bookings from; or a pie chart with a breakdown of these numbers.
In order to get more information from this last section, you need to have the Nationality Custom Field set up in your profile:
Go to Settings > Product & Booking Settings > Customs Fields > Guest.
Create a new field, and assign the Nationality Field type to it:

Now, you will start to get the whole advantage BI can give you.
NOTE ! This feature is not available in each plan. Speak to your Account Manager to get it or to find out more.