Business Intelligence III: Turnover by Channel
This report will tell you about the sales you have from different sales channel like Agent Booking, API Booking, Website Booking, Mobile app, etc.
Last Update: December 17, 2025
Here is an overview of what we cover in this article:
- Overview
- General Information
- Agent Bookings
- API Bookings
- POS Desk Bookings
- Backend App Bookings
- Website Bookings
- Website Mobile Bookings
- mPOS Bookings
_______________________________________________________
Overview
The variety of channels that we can get bookings through today has created a huge necessity to have these bookings filtered somewhere to get information from those numbers.
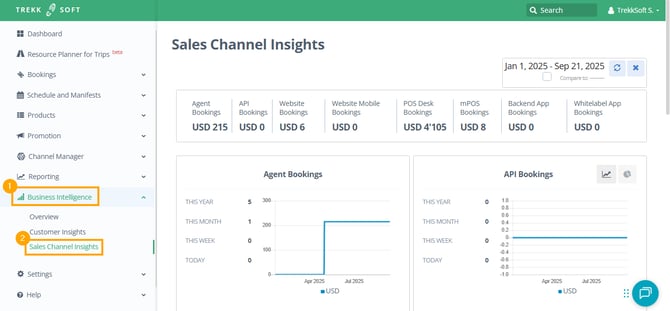
With that in mind, TrekkSoft is building the following dashboard to provide you with this information. See below how you get to this report:
_______________________________________________________
We've divided it into these sections:
General Information
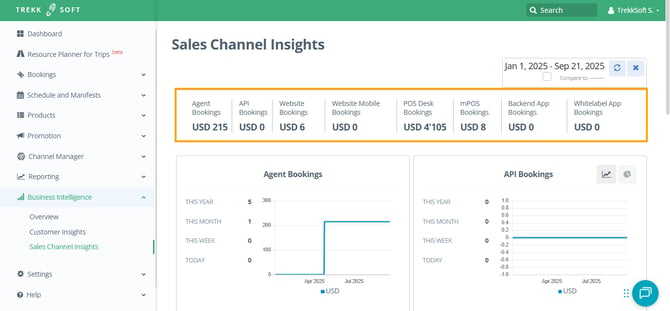
In this section, we show you on monetary terms, how much each of your channels has brought you during the selected period.
-
Agents Bookings
These are the bookings taken from the POS Desk.
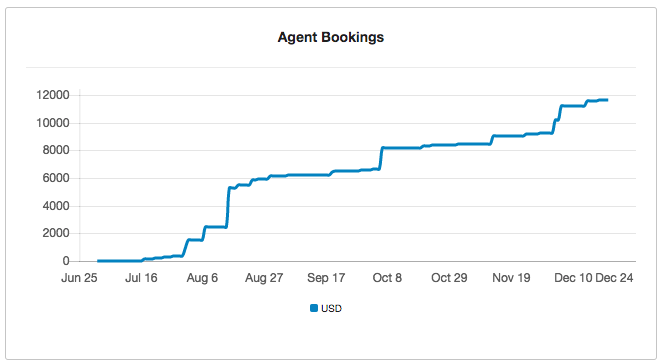
On the left side, the amount of money the made for you. The bottom axis is the date. This can be controlled by the date filter at the top-right corner of the page.
This is the aggregated data: everybody's effort is represented on this graph.
-
API Bookings
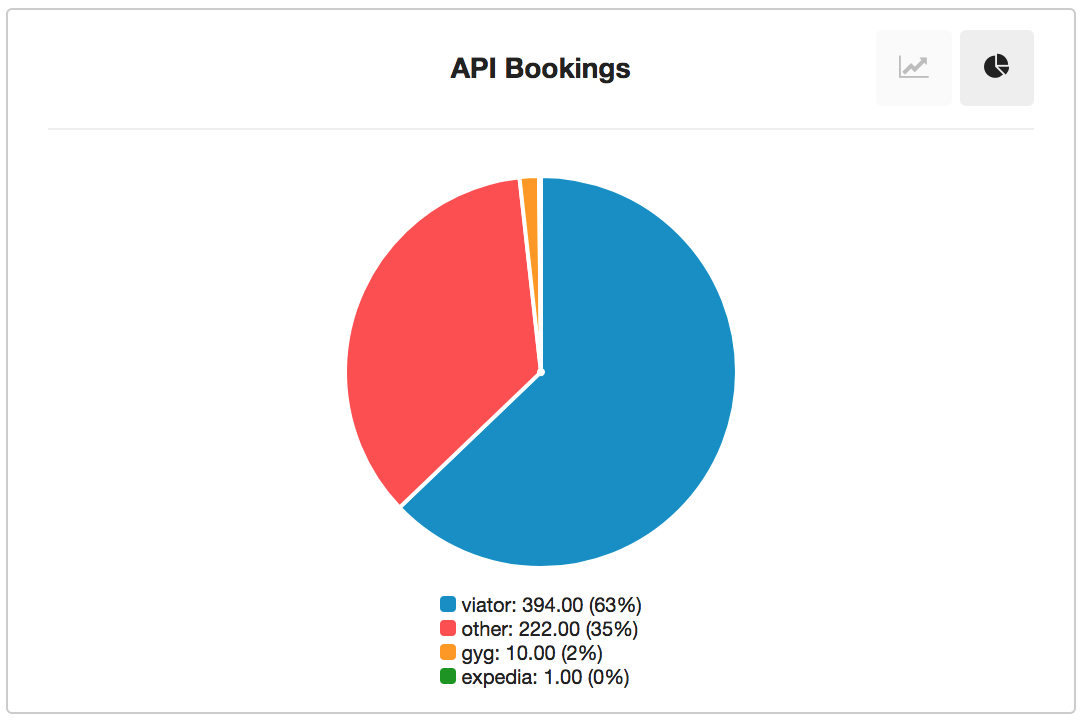
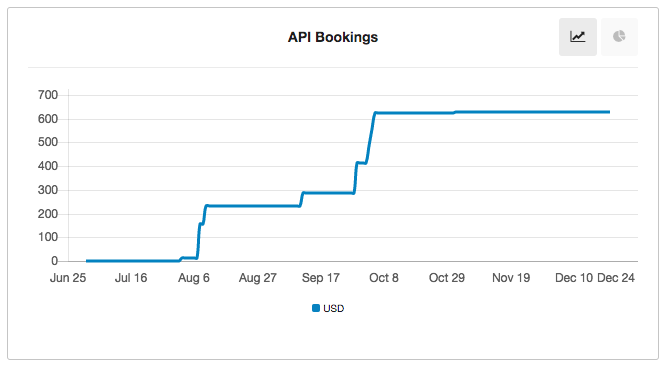
In other words, your Marketplaces!
Here you can see two graphs in one:
- The aggregated data representing the amount of money coming from all your marketplaces at once.
- Pie chart with divided data where you can compare your marketplaces to each other.
-
POS Desk Bookings
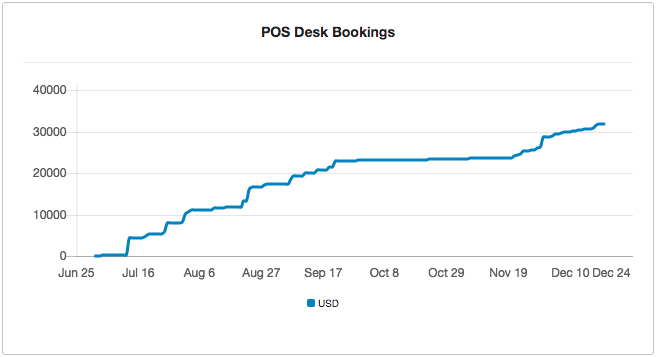 These are the bookings coming from your Point of Sale Desk. Depending on how you use it (you have it displayed publicly so your customers book themselves in, or you give it to your agents for them to look at it), these metrics can tell you different things.
 If you have for public use, you'll see the number of clients coming into your shop and serving themselves.
If it's your agents who are using the POS Desk, you can cross-reference this data with the Agents Bookings to see if booking desk works better, or POS Desk is working better.
On the left side, you can see the amount of money coming from this source. The bottom axis is the date. This can be controlled by the date filter at the top-right corner of the page.
This is aggregated data: all bookings are represented here at once.
-
Backend App Bookings
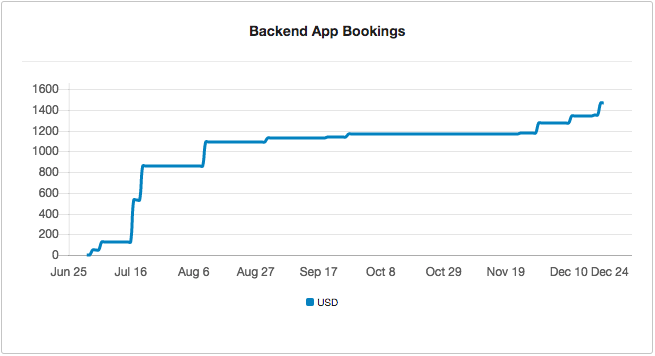
These are the bookings taken from the TrekkSoft Mobile App (Apple/Android).
On the left side, you can see the amount of money coming from this source. The bottom axis is the date. This can be controlled by the date filter at the top-right corner of the page.
This is aggregated data: all bookings are represented here at once.
-
Website Bookings
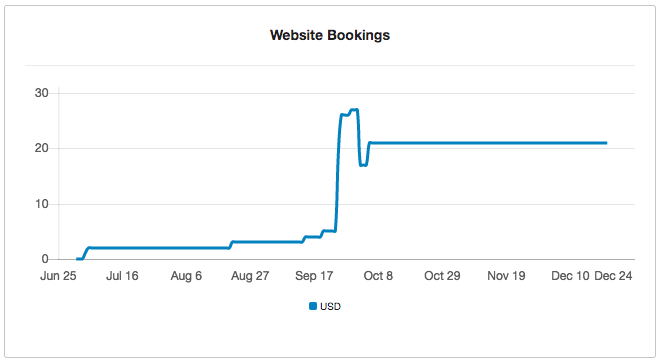
These are the bookings coming from your website, built with TrekkSoft or Integration.
On the left side, you can see the amount of money coming from this source. The bottom axis is the date. This can be controlled by the date filter at the top-right corner of the page.
This is aggregated data: all bookings are represented here at once.
-
Website Mobile Bookings
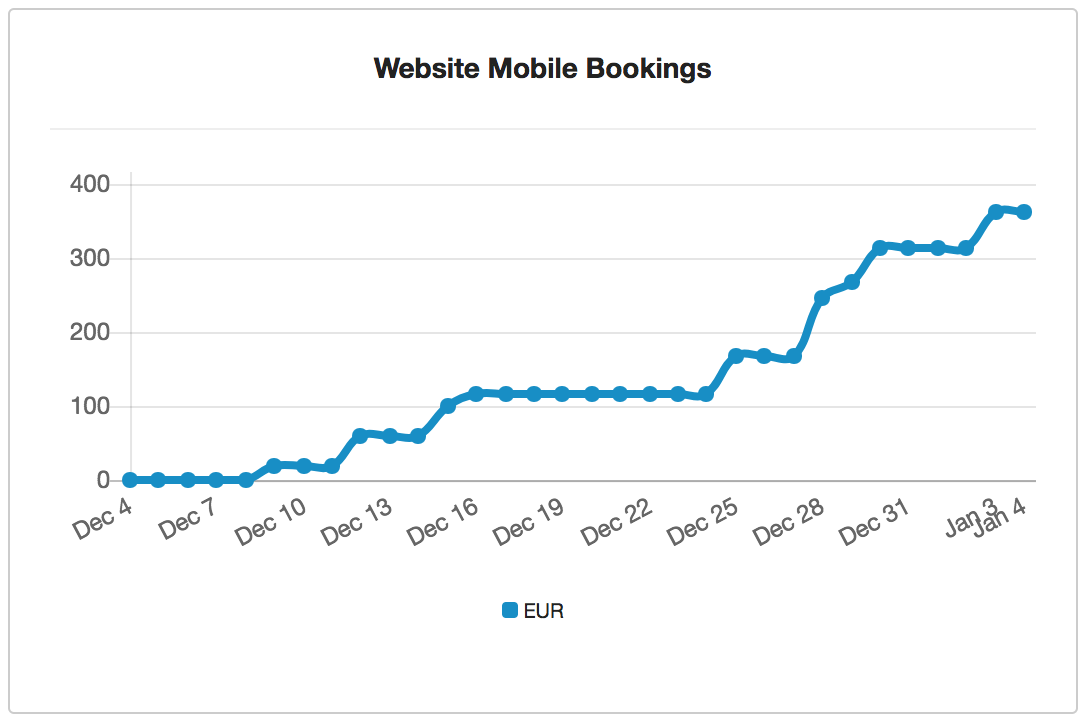
These are people booking on your website through their mobile phone (either TrekkSoft or Integration). They are on the go, already traveling and they decide to book with you at the last minute, these are customers you have to take care of!
On the left side, you can see the amount of money coming from this source. The bottom axis is the date. This can be controlled by the date filter at the top-right corner of the page.
This is aggregated data: all bookings are represented here at once.
-
mPOS Bookings
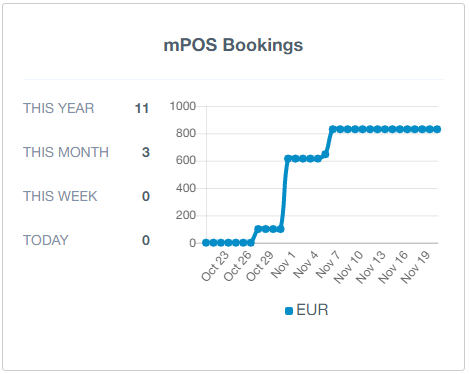
These are the bookings coming from your mPOS mobile app that you booked directly from the mobile app (mPOS)
On the left side, you can see the amount of money coming from this source. The bottom axis is the date. This can be controlled by the date filter at the top-right corner of the page.
This is aggregated data: all bookings are represented here at once.
If you have any feedback for us please don't hesitate to leave it in the comment section. If you don't see the Business Intelligence option in your menu in the Admin Desk, contact your account manager or a salesperson.
